In this article, we’re going to focus on how to check memory usage on Linux because this is an important skill to have. Sometimes apps will start hogging all the system memory and you’ll need to know the troubleshooting steps you need to take to find the issue. So here are the best command-line tools to check memory usage on your Linux system.
1. The “top” Command
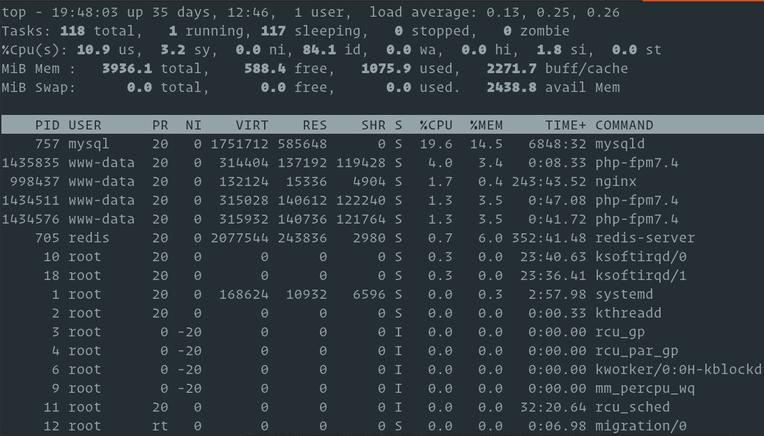
The top command-line tool will give you a summary of all the running processes. This summary includes real-time information on memory usage, so you can use it as a monitoring app as well. You can see how much of your system memory is used in total and then you can go through the list of processes to check how much of that memory is used by every process. To run this tool, simply type the top command: $ top The top command shows you your Linux system’s total and free amount of memory as well as the used physical and swap memory. The most important column, in this case, is %MEM because it tells you how much physical memory each process used. Then you can identify the rogue app that’s eating too much memory and kill it. Also, you can use the top command-line tool to check the CPU usage. Just check the %CPU column to see how much processing power is used by each app.
2. The “free” Command
If all you need to learn about your system’s memory usage is the amount of free and used memory, you don’t really need the top command. The free command will be enough. Type free in the terminal and instantly learn how much physical and swap memory is free or used. At the same time, you get information about the buffers that the kernel uses. Keep in mind that the memory usage information doesn’t appear in real-time. You can use the free command line to monitor memory usage. Essentially, this is a screenshot that tells you how much memory was free or used when you typed the command. Use the top command if you want to monitor memory usage or to learn how much memory each process uses.
3. The “htop” Command
The htop command is basically the top command tool with an easier-to-read environment and user-friendly controls. It outputs RAM usage in real-time, gives you a list of all the running processes, and it gives you shortcuts to commands that control the processes. Once you see the process that eats up too much RAM, you can press the shortcut key to kill it instead of using Bash commands. To use the htop command, you need to type htop in the terminal. That said, you might get an error if your Linux distribution doesn’t come with this tool by default. In that case, type the following command to install it: $ sudo apt-get install htop
4. The “vmstat” Command
The vmstat command will display the virtual memory statistics report. The command will give you more information than you probably need, but if you’re planning to become a Linux system admin, you should know it. The report includes the following information:
The number of processes (procs) that way for run time.The amount of swapped memory, free memory, cache, and buffers.Blocks received and sent to a block device (IO).CPU times (user time, system time, idle time).
Type vmstat in the terminal to get the virtual memory statistics report.
5. Check the “proc/meminfo” File
You’re probably wondering where your Linux system gets all these reports and information on RAM usage. Well, pretty much all of the command line tools you used so far have the same source: the proc/meminfo virtual file. If you want to go directly to the source and get all the memory usage information you want, you can easily access the file by typing the following command: less /proc/meminfo The report is quite long, so you should use the less command to get some navigation control to quickly scan through the output for the data you need. That said, this detailed report contains a lot of information you probably don’t need. So here are the most important values you should focus on:
MemTotalMemFreeMemAvailableBuffersCachedSwapCachedSwapTotalSwapFree
6. Use the GUI
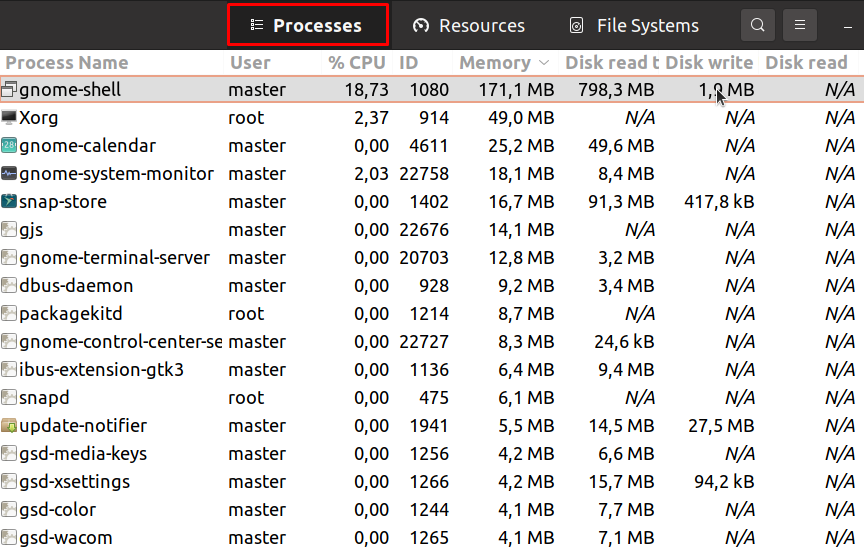
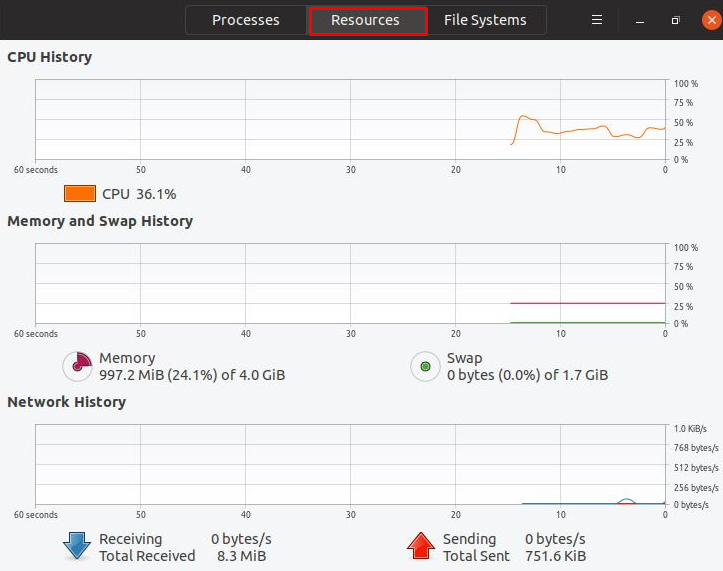
Linux purists might be against using the GUI over command line tools, but having a visual representation of RAM usage is great. You can get all the information you need and monitor your system’s memory usage in real-time by using the Linux System Monitor app. To use the app, type “System Monitor” in the start menu’s search bar and press Enter. The System Monitor has two tabs we’re interested in: the Processes and Resources tabs. In the Processes tab, you can see all the processes that are currently running on your Linux operating system. You can read memory usage, CPU usage, and other data for each individual process. This is where you can learn if one of the apps has gone rogue and is using way too much RAM. Then you can kill the process from the same window by right-clicking on it and selecting the kill option. That said, if all you need is to learn how your system memory and CPU have been behaving, you should check out the graphical visualization in the Resources tab. Here you can see the CPU, RAM, and network history as a graph. This means you get historical data on your system’s memory usage over a certain period of time and you can also monitor that usage in real-time. How do you prefer to check memory usage on your Linux operating system? Do you know other commands and tools that can get more valuable data for analysis? Let us know in the comments below!


